I’ve said this in the past, but it’s worth repeating: at Zenput, we are practitioners of reality. We are the real-time operational insights provider through our mobile software solution. Our customers in the convenience store, restaurant, retail, and CPG spaces realize our value as they customize our platform to fit their own unique operational needs. We’re always talking about real-life solutions to real-life problems.
With that mindset and approach, we don’t always concern ourselves with theory and hypotheticals. So the other day, as I was reading up on industry trends, I came across a “textbook” representation, and really a validation, of what Zenput offers.
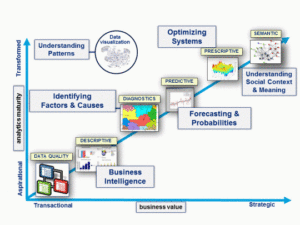
Class is in session, and I shall profess! First, check out the chart below (credit to Scott Allen Mongeau for this visual):
 First, observe the two axes: “analytics maturity” and “business value.” Notice as analytics mature, they become more transformative for your business and as business value increases, it becomes more strategic.
Now look at where the chart begins: Data Quality is the figurative “low man on the totem pole.”
How is your data quality? Are you still using spreadsheets? Paper and pencil checklists? There’s a better way to collect data than manual processes. In fact, to move upward on this trajectory, you’re going to have to use technology and automation.
So you adopt technology and you get promoted to Descriptive (business Intelligence). Say you adopt Zenput, which has the basic function of giving you the ability to document or report conditions at your locations in real-time. You essentially create a mobile checklist that you can distribute to store managers with the click of a button in real-time, and the answers are collected in real-time. Great! But you can do so much more...
The next step on your trajectory is Diagnostics. Set up Zenput to alert you of exceptions. For instance, your managers numerically rate the promotional execution from 1 to 5, and you get alerted to any display that scores a “3” or below. Zenput easily identifies those stores, allowing you to virtually check in and see what the problem is. You also have the ability to follow-up on any shortcomings that were documented during the descriptive phase. Assign follow-up tasks and monitor compliance in real time. This is when you start to gain even more knowledge about challenges your managers have at the store level. For instance, maybe the promotion wasn’t executed correctly because the vendor or distributor did not deliver the correct materials. If this happens across several locations, it can be a major setback. But now, you’re wiser for having diagnosed the cause of the problem. Move up another step in your trajectory to Predictive (forecasting and probabilities).When it’s time for your next retail promotion, you can now plan better with your vendor or distributor to set yourself up for success. You can better predict what might happen, all the while still documenting and diagnosing what actually does happen at the store level. Think of it as a continuous cycle of learning and adjusting. The next promotion is Prescriptive (optimizing systems). Zenput has dashboard views with historical analysis and reporting functions. Want to know just how well that summer beverage promotion was executed? The data is right at your fingertips. You start to see patterns in your operations, which according to the diagram, can be transformative to your business. Finally, the ultimate phase of your trajectory is Semantics (social context and perception). Honestly what is the point of this discussion about trends in data analytics? It’s to elevate your brand and deliver the best customer service experience possible. Optimizing internal operations will translate externally to customers. You know it’s true: customers know when you don’t have your stuff together. This is what damages brands over time. Not to bust on the Golden Arches, but that is one of the areas where McDonald’s has struggled in recent history. Widespread operational inefficiencies began to affect the customer service experience and brand loyalty. Well that concludes my business theory lesson, and I hope you’ve seen the value of mobile technology and where Zenput fits in the data analytics diagram. Share this post with that person in your organization who needs to see the value of mobile tech in order to believe! Before I dismiss this class, I’ll leave you with one last word of wisdom, if I may: start somewhere. Start with the technology that’s right in your pocket. Consider mobile technology and how it can improve your data, diagnostic abilities, and planning. Use mobile to your advantage, because if you don’t, a competitor will!Subscribe to our blog
You are now subscribed!


